Slow progress in expanding clean cooking access is hindering progress on health, gender, equity, climate and air quality goals globally. Despite a rising population share with clean cooking access, the number of cooking poor remains stagnant. In this study we explored clean cooking access until 2050 under three reference scenarios, a COVID-19 recovery scenario and ambitious climate mitigation policy scenarios. Our analysis shows that universal access may not be achieved even in 2050. A protracted recession after the pandemic could leave an additional 470 million people unable to afford clean cooking services in 2030 relative to a reference scenario, with populations in sub-Saharan Africa and Asia the worst affected. Ambitious climate mitigation needs to be twinned with robust energy access policies to prevent an additional 200 million people being unable to transition to clean cooking in 2030. Our findings underline the need for immediate acceleration in efforts to make clean cooking accessible and affordable to all.

Energy for cooking is a most fundamental need. Yet today, over three billion people still cook by burning wood on open fires and in smoky stoves. The enormous social, public health and environmental benefits of transitioning to cleaner cooking underpin the inclusion of a universal access target for this under the United Nations Sustainable Development Goal 7 (SDG 7) 1,2,3 . Even before the COVID-19 pandemic, data showed that efforts to provide clean fuels and stoves have been lagging far behind those aimed at extending electricity access 4 . A recent report claims that this sluggish progress in providing clean cooking access is costing the world more than US$2 trillion each year as a result of health impacts, productivity losses and environmental degradation 5 . Mounting evidence of the impacts of air pollution exposure on COVID-19 mortality makes universal access to clean cooking services more urgent 6,7 . Despite this, emerging evidence suggests that the economic fallout of the pandemic might pose a further setback to efforts to reach this goal, as many are forced to climb down the energy ladder 8,9,10 .
Previous literature analysing scenarios for achieving universal access to modern energy services have focused predominantly on electricity supply to assess the cost-effectiveness of alternative options to provide connections 11,12,13,14 . There is a paucity of studies analysing clean cooking scenarios, particularly at a global scale 15,16 . Existing studies that focus on cooking access scenarios are limited in their representation of multiple cooking fuel use (fuel stacking), population heterogeneity and affordability constraints, which are critical to understanding whether people will regularly use new fuels or stoves after they acquire them 17,18,19 . The limited existing evidence, preceding the pandemic, suggests that the world is far off the mark of the SDG 7 goal, with nations in sub-Saharan Africa projected to not achieve this target even in 2050 5,20 .
In this study we explored clean cooking access until 2050 under reference scenarios of socioeconomic and demographic change, ambitious climate mitigation policy scenarios and a slow economic recovery from the COVID-19 pandemic scenario (see Methods for scenario details). We applied existing microdata-based cooking choice and demand models that explicitly consider fuel stacking and represent affordability constraints for urban and rural populations, capturing heterogeneity in household preferences across the entire income distribution 21,22 . We find that a slow recovery from the pandemic and fuel price changes because of ambitious climate mitigation policy could substantially retard progress in achieving universal clean cooking access if additional policies related to energy access and poverty alleviation are not simultaneously pursued. Those most at risk of not being able to afford to transition to clean cooking are low-income households in sub-Saharan Africa (AFR), developing Asia, and Latin America and the Caribbean (LAM). A faster transition to clean cooking fuels can attenuate future growth in cooking energy demand, especially in regions that currently depend largely on biomass and other solid fuels.
In what follows, we define clean cooking as cooking with modern fuels such as liquid petroleum gas (LPG), electricity and piped gas, which when used in modern stoves result in little to no household pollution. Newer options, for example, bioethanol or solar electric, might become viable in the future, but were not included in our analysis as we detected no use of these in the empirical datasets that we employed. All other fuels, including solid biomass-based firewood or charcoal and coal, are categorized as polluting, because prevailing stove technologies that use these result in pollution levels that exceed World Health Organization indoor air quality guidelines for household fuel combustion 23 . We categorize a household as cooking poor if it depends on polluting cooking fuels, that is, on fuels other than those we define as clean, for half or more of its cooking energy consumption. In our analysis we compared an especially constructed COVID-19 recovery scenario (COVID) with three reference scenarios, namely sustainability (SSP1), middle-of-the-road (SSP2) and regional rivalry (SSP3), from the Shared Socioeconomic Pathways (SSP) framework 24 . We further compared our recovery and reference scenarios with a set of scenarios that impose an ambitious climate mitigation policy that limits warming to 2 °C by the end of the century (CP2C) using a previous formulation that assumes a regionally differentiated carbon price trajectory that rises gradually over time 25 (see Methods).
Our findings show that the share of the population with access to clean cooking rises under all scenarios until 2050, but no scenario meets the rate of improvement required to achieve the SDG 7 2030 target (Fig. 1 and Supplementary Fig. 1). Even under our most optimistic reference growth scenario SSP1, we found that close to 38% of the global population could continue to remain cooking poor in 2030. Slower growth and urbanization under the SSP2 and SSP3 reference scenarios could leave an additional 1.2–3.9% of the population unable to afford clean cooking in 2030. We found universal access may not be achieved even in 2050.
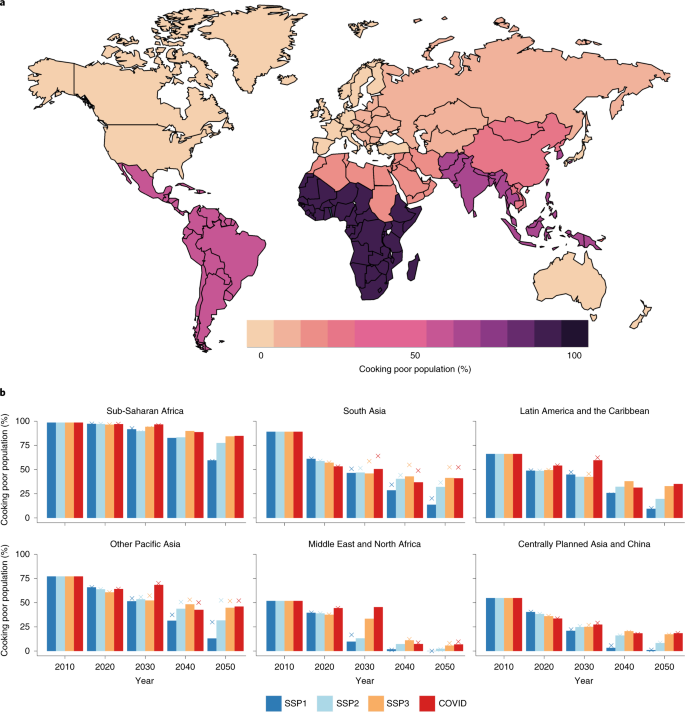
Under our COVID recovery scenario, an additional 470 million people may remain cooking poor in 2030 as compared with under SSP3, our most pessimistic reference growth scenario. The COVID scenario has a persistent impact, as, even though average income levels are assumed to revert to the reference SSP3 trend in 2040, income inequality remains higher until the middle of the century, leaving more families dependent on biomass even in 2050. Ambitious climate mitigation policy in the absence of additional targeted support policies could also make transitioning to clean cooking more difficult for about 200 million people, specifically those in Centrally Planned Asia (CPA) and South Asia (SAS), where fossil fuel demand for cooking is currently high and most households are unable to afford electric cooking.
In AFR, we observed only very moderate improvements in access to clean cooking services over time as population growth in this region outpaces the rate of transition to better stoves and fuels in all scenarios. In contrast, in CPA, SAS and Other Pacific Asia (PAS), clean cooking access becomes increasingly affordable, especially under an optimistic SSP1 reference scenario. Overall, differences on account of income growth, distribution and urbanization in our reference scenarios impact clean cooking access more than shifts in fuel prices as a result of ambitious climate mitigation policy. However, in regions of developing and emerging Asia, climate mitigation policy could increase the cost of clean cooking services. Implementing additional support policies to make clean cooking affordable will be essential to achieve both climate goals and SDG 7 simultaneously in these regions.
In many developing regions, cooking is still the most energy-intensive activity in homes. Figure 2 shows future total cooking energy demand by scenario. We see a decline in biomass use over time in all reference scenarios with a faster phase out under SSP1 compared with the other reference scenarios (Fig. 2a). Under the COVID scenario, we observe a much larger share of solid fuels, and higher total cooking energy demand because of the inefficiency of these fuels. This large COVID effect could result in an increase in biomass use until 2030, with a light rebound in 2040, when income levels are assumed to go back to the reference SSP3 trend. Climate mitigation policies could attenuate the transition away from polluting stoves by making oil and gas-based fuels more expensive. The higher prices could also result in lower average per capita final cooking energy demand under the climate mitigation policy scenarios as compared with the reference scenarios and a much smaller proportion of gas in the cooking energy mix.
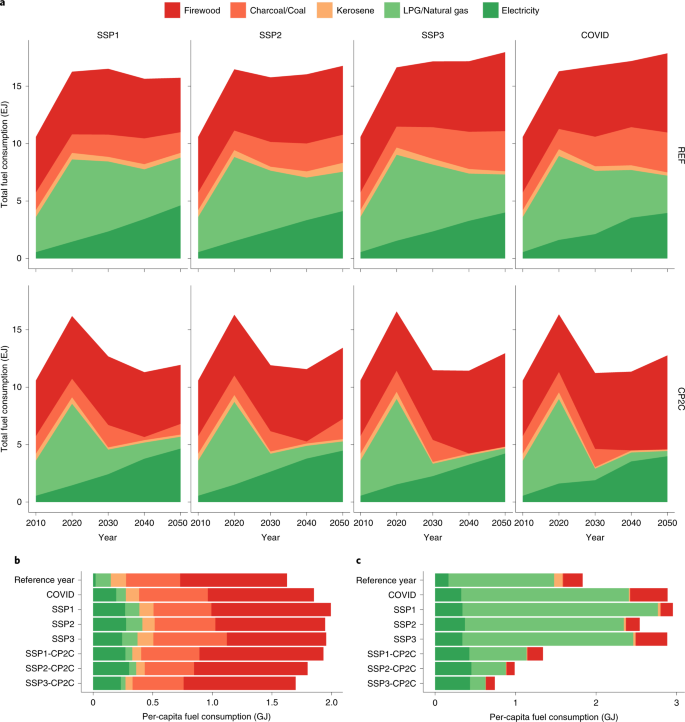
We find that the rate of change in cooking energy demand across regions varies. In developed regions, there is little change in the reference scenarios as there is little transition in fuels over time, and population and urbanization remain quite stable. In emerging and developing regions, for example, CPA, income growth and urbanization result in shifts from less efficient to more efficient fuels, but population shifts could mean relatively little change in total cooking energy demand. On the other hand, in AFR, total cooking energy demand could increase over time on account of rapid population growth and a slow transition away from polluting stoves. We also find demand may rise initially in the region, as populations move out of extreme poverty. Cooking energy demand can rise if households increase cooking frequency, shift diets to eating different foods or simply cook more food.
Differences in the average per capita cooking energy demand in the year 2030 by scenario are depicted in Fig. 2b,c. We distinguished regions that are more dependent on biomass (that is, AFR, LAM, PAS and SAS) from other regions of the world that are not. The differences in average cooking energy demand between the two are stark. Furthermore, the differences between scenarios are more pronounced for the non-biomass-dependent regions (Fig. 2c). Under the climate mitigation policy scenarios, we find cooking energy demand could be lower than in the reference scenarios, as the consumption of gas may decrease substantially, more so in regions that are non-biomass-dependent to begin with, and there could be an increase in electricity consumption instead. In the COVID scenario, we find cooking demand could be lower than in the reference scenarios in the biomass-dependent regions, because of lower income levels (Fig. 2b). In the non-biomass-dependent regions too, biomass demand could be slightly higher in the COVID scenario. More biomass use is also likely in the SSP3 reference scenario as compared with the SSP1 reference scenario.
In line with the literature, we found that rising incomes and urbanization drive a transition to cleaner fuels and stoves 17,26,27 . However, within and across regions, the nature and pace of this transition vary vastly depending on several factors beyond income. In Figs. 3 and 4 we present the total cooking energy mix in 2030 for the full income distribution by region and scenario, separately for rural and urban populations, respectively. Income is presented in the logarithmic scale to better visualize the transitions at lower levels of income.
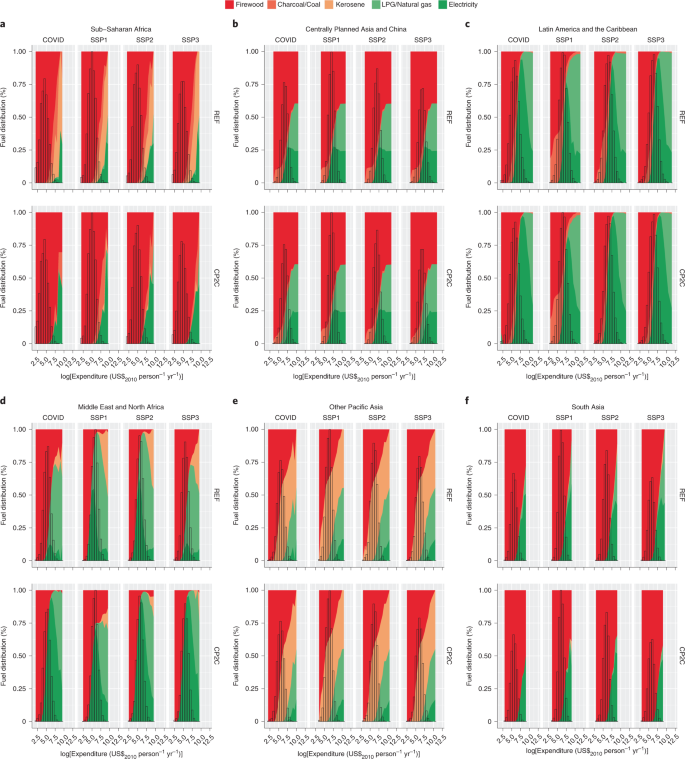

Clear differences in the pace and nature of the transition in cooking fuels across regions are evident. In rural CPA in the COVID scenario (top left panel of Fig. 3b), we see most households with very low incomes per capita (approximately less than US$5 per capita per day). We see a transition from high firewood dependence at lower income levels to almost equal shares of firewood, gas and electricity at the highest income levels. Households with middle-income levels could still rely mostly on biomass fuels. By contrast, among urban households (top left panel of Fig. 4b), income per capita levels are higher (up to approximately US$17 per capita per day). These households are likely to depend mostly on gas and electricity. The pattern varies greatly across other regions, even at comparable income levels. Nevertheless, overall, we see a strong income effect on the choice of cooking fuels, with households with higher levels of income transitioning to either gas or electricity in all regions, except in the Middle East and North Africa (MEA), a region rich in fossil fuels and poor in biomass. In MEA, higher-income households could continue to use cheap kerosene, in line with what we observed in the empirical data (see Methods section).
For lower-income rural households, especially in AFR, SAS and, to a lesser extent, LAM, we find a large share of total cooking energy demand could still be biomass-based even in 2050, particularly in the COVID scenario. In the climate mitigation policy scenarios too, an increase in fossil fuel prices could increase the dependence on biomass, with the price effect dominating the income effect in determining the choice of fuels. Considering regional heterogeneity, in AFR and SAS, regions that are most acutely dependent on biomass today, we find price sensitivity could be higher under the climate mitigation policy scenarios.
In addition to income, our analysis shows a clear urban–rural divide in fuel choice, with even richer households in rural areas likely to continue relying on solid fuels because of their easy access and the poor accessibility to cleaner alternatives. Indeed, as we can see from the example of CPA, there are stark differences in the choice of cooking fuels between urban and rural households even at the same income levels. We observed this in other regions of the world as well (Supplementary Fig. 3).
Finally, we find energy prices also affect cooking fuel transitions. For instance, in SAS, we find that in the climate mitigation policy scenarios, rising fossil fuel prices could push LPG out of reach of many. However, future transitions in this region remain the most uncertain, as there are currently strong policies to expand LPG access to even rural households in India. The effect of these policies are only becoming evident now and are not reflected in the data that we used to estimate the parameters for this region (see Methods section).
Our findings on the transition in cooking fuels discussed above suggest that access to clean cooking is clearly a poverty issue. This is further illustrated in Fig. 5. In Fig. 5a we show the relationship between cooking poor and income poor populations (defined as those earning less than US$5 per capita per day). We see that in AFR, and to a lesser extent in LAM and PAS, income poverty strongly correlates with cooking poverty. In other regions, this is less so, as the number of poor individuals is much lower than those dependent on solid fuels. This can be explained by the existence of natural resources that result in lower prices of liquid fuels in some regions (for example, MEA), or sustained public policies aimed at poverty alleviation and increasing access to clean cooking in others (for example, in CPA and SAS).
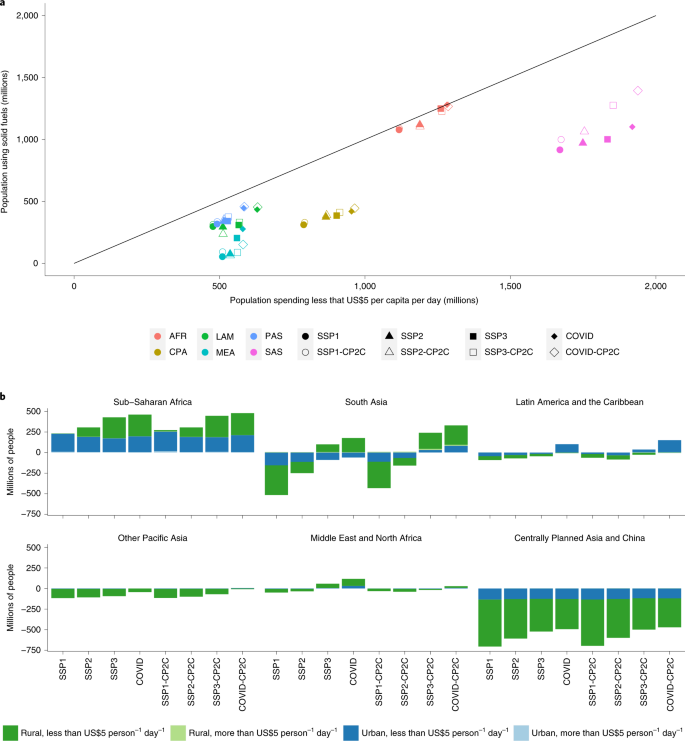
In AFR, we find that future income growth may not compensate for the effect of population growth, so that the number of cooking poor could increase in all scenarios. What is also evident from Fig. 5b is that AFR could remain largely rural in 2030, and between 94% (in SSP1) and 98% (in COVID) of rural households could earn less than US$5 per capita per day and remain cooking poor in 2030. In SAS too, 78% (in SSP1) to 90% (in COVID) of the rural population could earn less than US$5 per capita per day and remain cooking poor in 2030. In other regions of the Global South, we found that about 15% more people could remain income poor in the COVID scenario compared with in the SSP3 scenario.
In other regions of Asia, specifically in CPA, but also in PAS, the number of cooking poor is likely to decline between 2010 and 2030. In these regions, not only do we find that many move out of poverty, but also rising urbanization makes clean fuels more accessible and affordable. For example, in CPA, in the COVID scenario, we observe that a little less than half of the rural population could earn less than US$5 per capita per day and depend on solid fuels, but the percentage of urban households in this category is likely to be negligible.
We find outcomes differ by scenario in MEA, LAM and SAS. In these regions, in the SSP1 and SSP2 scenarios we observe there could be a reduction in cooking poor, but in the SSP3 and COVID scenarios we find that the extent of both poverty and cooking poverty could rise. In MEA and SAS this is largely explained by differences in urbanization between the SSP1 and SSP2 scenarios as compared with the SSP3 and COVID scenarios. In LAM, however, we find even urban households could remain cooking poor, as income inequality is higher in this region, even in countries that have a gross domestic product (GDP) per capita comparable to that in most developed regions. Therefore, we find many people could remain income poor even in 2030. Especially in the SSP3 and COVID scenarios, we find that 60% of rural and about 50% of urban populations could earn less than US$5 per capita per day and depend on solid fuels for cooking.
In general, our findings show that clean cooking access in the COVID scenario is likely to be lower than under the climate mitigation policy scenarios. In SAS, however, the urban poor could be particularly affected by rising gas prices under the climate mitigation policy scenarios, with the dependency on solid fuels for this group almost doubling. However, even in this region, solid fuel dependency is much higher at 7% in the COVID scenario in 2030 as compared with under the climate mitigation policy scenarios (2% in SSP3-CP2C).
Our analysis provides new insights into how access to clean cooking services may change under alternative reference scenarios, a slow pandemic recovery scenario and climate mitigation policy scenarios. Our findings show that the SDG 7 target of universal clean cooking access by 2030 could be out of reach under all the scenarios we explored. In regions that currently have the highest access gaps, specifically AFR, SAS, PAS and LAM, universal access may not be achieved even in 2050. A protracted recession following the pandemic could further retard progress towards achieving this goal. Our findings resonate with recent analysis that suggests that the aftermath of the pandemic could push half a billion people back into extreme poverty 28 . Climate mitigation policies may also hamper a transition to fossil-based cleaner burning cooking fuels by making these more expensive and putting them out of reach of many if not twinned with appropriate additional policies specifically targeting the cooking poor in AFR, parts of developing Asia and LAM.
The location and supply of fuels and their affordability are critical drivers of the trends that we observed. In MEA, where biomass supply is limited, we found dependence on cheap kerosene could remain high. In AFR and LAM, where many households are remotely located, have easy access to biomass resources and limited access to modern cooking services, we found biomass dependency is likely to persist. For these populations, the inconveniences and health impacts of cooking with polluting stoves need to be factored into the household choice decision. This requires committed and sustained policies to provide easy access to modern fuels and stoves at affordable prices, and information and behaviour change messaging. If anything, studies in regions that are enforcing such policies now (for example, India) show that these behaviours can be persistent, and providing households access to new stoves and cleaner burning fuels alone may not be enough to promote their regular use 29,30 .
Our analysis has some limitations that point to important avenues for future research. Our model can capture a wide variety of heterogeneity in circumstances and population characteristics, but our results are only as good as the input data used. As our methods are based on empirical data, we could only include cooking options that exist in the datasets that we employed. Although newer alternatives that might become viable in the future were not explicitly modelled, our analysis can inform policy of the price points and income levels at which populations in different regions will be able to afford new fuels and technologies. Because cooking behaviours appear to be quite persistent, future research should consider using panel or pseudo-panel datasets that can better capture longitudinal shifts. Our analysis could also be further expanded to better assess how societal changes, such as better education and women’s empowerment and labour force participation, relate to cooking energy choices. We did not include institutional capacity and governance constraints that might limit the expansion of supply of certain cooking options or the effectiveness of policies in specific contexts. In addition, our analysis did not assume any climate feedback on biomass availability. Both unsustainable harvesting and future climate change could reduce the availability of abundant biomass resources in certain regions. Alternatively, more sustainable land and biomass management could make supplies more abundant and encourage new biomass-based clean cooking options 31,32 .
Insights from our analysis emphasize the increased urgency to address this issue, which has been left on the back burner for far too long. A recent report has highlighted the chronic underinvestment in the sector, particularly in regions where this is needed most 33 . Recent estimates suggest that achieving universal access to clean cooking services by 2030 will require US$4.5–9.8 billion annually 5,33 . We estimate an average expenditure gap of US$10.5 billion annually between 2020 and 2030, comparing the reference SSP3 and COVID scenarios. This includes the cost of stoves and expenditure on fuels, and is in line with previous estimates. These estimates are an order of magnitude lower than the US$2 trillion of estimated losses incurred each year from a lack of access 5 . Recent commitments pledged to COVID-19 recovery funds are in the range US$9–15 trillion 34,35 . Directing even a fraction of 1% of these funds to eradicating cooking poverty could help bridge the financing gap to meet the SDG 7 target.
Countries like Brazil, India and Indonesia have expanded access to clean cooking services considerably in recent years 36 . This has been achieved through strong government commitment and extensive subsidies. But sustaining these subsidies can become a fiscal burden. Better targeting of subsidies, through efforts like India’s Give It Up campaign, and better market segmentation could help 37 . In addition, directing green and climate funds and revenues from carbon pricing to the clean cooking sector can be another way to increase financing to this sector 38 .
Despite the challenges in extending clean cooking access, recent advances in technologies 39 and new payment and financing models 40 can help clean cooking services reach even low-income households. In urban centres, providing piped gas to dense settlements and introducing smaller LPG cylinder sizes, pay-for-service financing models, smart metering for gas with electronic payment options as well as more reliable and affordable electricity can be instrumental in encouraging a more rapid transition to clean cooking. For rural regions, awareness-raising and behaviour change campaigns are also important to ensure that those who gain access use new stoves regularly 41 . Our results suggest a need for much greater prioritization and coordinated policies to provide access to clean cooking globally, with efforts targeted at the most disadvantaged, specifically the poorest regions and populations. This will require considerable upscaling of investment, capacity and commitment, but can result in big benefits for planetary and population health and wellbeing.
We used microdata from a large set of nationally representative household surveys of different countries to estimate energy and cooking technology choices for regions of the world. We aggregated nations in line with the 11 regions of the MESSAGEix-GLOBIOM model 42 . The datasets used to represent each of these regions are presented in Supplementary Table 1, with a focus on regions of the world where access to clean cooking is lacking. Regions where access is not an issue (that is, North America (NAM), Western Europe (WEU) and Pacific OECD (PAO)) were included in our analysis and modelled independently, but are presented clubbed together in a single other or rest of the world region in some results.
None of these surveys report energy consumption for cooking purposes separately, but instead include data on total consumption or expenditure by fuel. This was not an issue for the modelling approach we followed for the Global North countries (as described further in the following subsection), but was relevant for regions of the Global South. Therefore, we used two different approaches to separate energy for cooking from energy for other end uses. Both approaches required us to create profiles of consumers who use the fuel for cooking and those who do not. Depending on the particulars of the specific national dataset, we then either used a simple regression approach to back out representative non-cooking consumption of households depending on a set of characteristics, or we calculated simple averages differentiated by income categories for urban and rural households separately. Importantly, the simulation-based estimation approach we followed largely minimizes the potential biases of such estimation, as we first obtained a guesstimate of cooking consumption using unbiased simulators derived from the first- and second-order moments of the empirical distributions, and next matched the non-biased first moments from the simulated data with the empirical data while minimizing errors in the second moments.
We used two different models for different regions of the world. For the Global South, where energy stacking is more prevalent, we used a previously developed model of household cooking fuel choices that allows for multiple fuel use 21 . For the Global North, where households generally use only one type of fuel, we used a different more general model of household energy and appliance choices 22 .
Both models follow a simulation-based structural econometric approach, wherein a large set of simulated households are constructed to mimic the characteristics found in the empirical data. Households choose between cooking alternatives to maximize utility given budget constraints and the prices they face in the market. All the simulated households have different characteristics (for example, income, household size and location, among others), and therefore the models capture heterogeneity with respect to these characteristics. The models, although different, work by backing out household preferences for different cooking fuels and technologies from the choices observed in the empirical data sources using different simulation-based estimation techniques. Therefore, the models only include options that appear in the different sources of household data (Supplementary Table 1), namely, firewood, charcoal and coal (usually lumped together), kerosene, LPG and natural gas (also usually lumped together), and electricity. Unfortunately, this implies that preferences for fuels that are lumped together cannot be distinguished from each other, and therefore are modelled as a single option. Also, other potential viable alternatives (for example, biogas and ethanol) cannot be included in the model. However, given that preferences are estimated independently for different regions of the world, the methods we employed allow for capturing local behaviours and preferences, which add more relevant layers of heterogeneity to our results.
For the Global South, we applied a simulation-based structural econometrics model of household cooking fuel choice (details of the model are available elsewhere 21 ). In brief, the approach assumes households maximize their utility U by choosing between the consumption of cooking fuels (allowing for fuel stacking, if households prefer to do so) and other items:
$$p_cC + \mathop \limits_^ \left( _f> \right) = I$$where C is the consumption of items other than cooking fuels, pc is the price of other consumption goods, pf is the price of cooking fuel f, Ff is the consumption of cooking fuel f, \(_f\) is an annualized representation of the cost of a cooking stove of fuel f, I is the household expenditure and \(\chi \left( > \right)\) is a function that represents preference shifts for reasons other than the consumption of the fuel, such as time savings or health impacts.
The unobserved preference parameters of the model (α, γ, \(\) , δ1f and δ2f) are backed-out from empirical data using the method of simulated moments 43 , a simulation-based estimation procedure that seeks to identify numerical parameter values that match a set of selected moments from the empirical data with the same set of moments computed from the simulated dataset of individuals with similar characteristics to their empirical counterparts in the data, whose fuel choices are then determined using the model described above.
The parameters were estimated independently for each region. To be representative, several sources of data were used for regions with very heterogeneous realities (for example, urbanization rates, natural environments, and supply of and accessibility to different cooking fuels and technologies). The fit of the model can be seen graphically in Supplementary Fig. 2. Naturally, regions that present non-smooth distributions of cooking fuels over income were harder to match (that is, CPA, LAM and PAS). Overall, the observed trends over income were appropriately captured by the model. The full set of matched moments are presented in the Supplementary Data file.
Cooking choices and demand in the Global North were estimated using a different simulation-based structural econometrics model that reflects the multiple choices of households in terms of fuels and appliances for different end uses 22 . In this model, households, based on their characteristics, make a discrete choice between available cooking technologies in each region, which is finally reflected in their total energy consumption for the respective fuel. Specifically, if households choose an electric stove, their electricity consumption is calculated as:
whereas if they choose a gas or biomass stove, their total alternative fuel consumption is calculated as:
where consumption xi is modelled as the sum of the base consumption of electricity ϕ0 and consumption due to ownership of appliances δjϕj, where δj represents the ownership of appliance j ∈ m and ϕj is the average electricity consumption of the appliance. In addition, each household’s consumption is affected by the price of electricity p1, the price of alternative fuels p2, a vector of household characteristics χ and the household’s disposable income (that is, total income y minus the annualized investment cost of electric appliances \(\rho \mathop \limits_^m K_j\delta _j\) ).
Finally, the actual cooking energy consumption is calculated as:
$$<<<\mathcalwhere ‘cook’ refers to the particular cooking appliance used by the household and i takes the value 1 if households use an electric stove and 2 if they use another fuel. The unknown preference parameters (α and the ϕs and λs) are estimated following a similar procedure to the one described above, albeit using a different estimation technique, namely indirect inference 44 , which is a generalized version of the method of simulated moments. The empirical fit of the model can be found in the Supplementary Data file.
We considered three different future reference scenarios following the narratives of the Shared Socioeconomic Pathways, specifically sustainability (SSP1), middle-of-the-road (SSP2) and regional rivalry (SSP3). Although the population 45 and urbanization 46 projections by country for the SSP scenarios that we used are as described in the references cited here, a special algorithm was applied to obtain separate income distributions for urban and rural households. Specifically, a machine learning algorithm 47 was applied to a large longitudinal dataset including average household income and Gini coefficient estimates for urban and rural households of all regions of the world to obtain associations between these indicators and other SSP drivers. The algorithm was trained on data from 1988 to 2010, and data from 2011 to 2015 were used for validation. These associations were posteriorly applied to the corresponding scenarios 25,45,46,48 to obtain the future income distributions for urban and rural households separately in all countries and regions.
The COVID scenario deserves special attention. For its elaboration, the original GDP trend for the reference SSP3 scenario from 2010 to 2019 was retained (as this is closer to the actual GDP trends in the past few years). For the years 2020 and 2021, we then used the most recent national GDP growth estimates from the World Bank 49 . We assumed convergence in GDP growth trends in the year 2040, considering a 20-year protracted recovery period from the pandemic worldwide. The revised GDP estimates were used to adjust the level of average household income in each region and period. The standard deviation, which is used to estimate inequality, was also adjusted in line with its association with GDP, urbanization and year. The Supplementary Data file contains values of all scenario drivers for the period of analysis.
We also considered ambitious climate mitigation policy scenarios that limit global warming to below 2 °C by the end of the century. The climate mitigation policy simulated in this analysis considers regionally differentiated carbon price trajectories as estimated by McCollum et al. 25 . Details of all key scenario drivers and assumptions are presented in the Supplementary Data file. The microdata-based structural estimation models described above are soft-linked to the MESSAGEix-GLOBIOM integrated assessment model 42 , which allows macroeconomic feedbacks via energy prices to be captured. These reflect changes in the energy supply mix and land use to meet estimated demands at least cost.
Links to the micro datasets that were used in the analysis are included in the Supplementary Information, when available. Given that some of these datasets are not publicly available, the data used for the estimation module is only available from the corresponding author upon reasonable request. The simulated datasets generated during the current study are also available from the corresponding author upon reasonable request. All estimated moments, scenario assumptions and the datasets underlying the plots are available in the Supplementary Data file.
The codes used during the current study are available from the corresponding author upon reasonable request.
M.P.-C. received funding from the European Union’s Horizon 2020 research and innovation programme under grant agreement no. 821124 (NAVIGATE). This work was partially funded by the contributions of the National Member Organizations of the International Institute of Applied Systems Analysis.